Ana3.2 K-Means分群實作
在此節中實作資料分群程式,對前一節所產生的2維資料點做分群。
首先,分群程式中所使用的 K-Means 分群演算法的細節內容如下:
# 產生k個中心點

for i in range(最大疊代數):
    # 將每一個資料點,指定到距離近中心點的群內
    # 更新中心點
    # 計算Square Error, SE
    # 停止條件: 當SE不再變動時停止
    # 記錄相關資訊
接者,分群程式的概念流程如下:
# 顯示開始訊息

# 讀取「訓練」資料檔
# 對「訓練」資料執行K-Means分群
# 儲存「訓練」資料的分群結果
# 顯示「訓練」資料的分群結果

# 讀取「測試」資料檔
# 對「測試」資料執行K-Means分群
# 儲存「測試」資料的分群結果
# 顯示「測試」資料的分群結果

# 顯示結束訊息
- 參考檔案: k-means.py
# coding=utf-8
# 匯入模組
import bisect
import copy
import matplotlib.pyplot as plt
import random
import sys

from sklearn.metrics.cluster import normalized_mutual_info_score as nmi


# 定義變數
PLOT_DISPLAY_AXIS = []


# 定義函數
def load_data(file_name=""):
    if file_name:
        data_list = []

        with open(file_name, "r") as f:
            for s in f.readlines():
                s = s.strip(" \t\r\n").split(",")
                s = [float(i) for i in s[0:len(s)-1]] + [int(s[-1])]
                data_list.append(s)

        return data_list
    else:
        print("[Err][Msg] No data to read.")


def add_center(data_point):
    # e.g., format of a center = [x, y, class-label]
    center_info = dict()
    center_info['dimensions'] = [i for i in data_point[0: len(data_point)-1]]
    center_info['num_members'] = 0

    return center_info


def plot_display_axis_configuration(data_list):
    global PLOT_DISPLAY_AXIS

    if not PLOT_DISPLAY_AXIS:
        x_max = -sys.maxsize
        y_max = -sys.maxsize
        x_min = sys.maxsize
        y_min = sys.maxsize

        for x, y, c in data_list:
            if x > x_max:
                x_max = copy.copy(x)
            if x < x_min:
                x_min = copy.copy(x)
            if y > y_max:
                y_max = copy.copy(y)
            if y < y_min:
                y_min = copy.copy(y)

        PLOT_DISPLAY_AXIS = [x_min-1, x_max+1, y_min-1, y_max+1]
    else:
        pass

    return PLOT_DISPLAY_AXIS


# ----------------------------------------------------------------------------------------------------
def distance_to_center(data_point, center_point, lamda=2):
    distance = 0.0
    lamda = float(lamda)

    for a, b in zip(data_point, center_point):
        distance += (abs(a - b)**lamda)

    return distance**(1.0/lamda)


def binary_pick(d):
    # create CDF
    for i in range(1, len(d)):
        d[i] = d[i] + d[i-1]

    # normalize D
    d_max = copy.copy(d[-1])
    d = [di/d_max for di in d]

    # pick a data-point as center
    f = random.uniform(0, 1)
    i = bisect.bisect(d, f) - 1

    return i


def linear_pick(d):
    total = sum(d) * random.random()

    for i, di in enumerate(d):
        total -= di

        if total > 0:
            continue
        else:
            return i

    # if above loop doesn't return any i,
    # it will come to here then return last one element of D,
    # but it should never come to here.
    return 0


def random_initialization(data_list, num_cluster):
    picked_data = sorted(random.sample(range(len(data_list)), num_cluster))
    center_list = [add_center(data_list[i]) for i in picked_data]

    return center_list


def k_means_plusplus_initialization(data_list, num_cluster, pick_type="linear"):
    # random pick one data-point as a center
    num_data = len(data_list)
    num_center = 1
    center_list = [add_center(data_list[random.choice(range(num_data))])]

    # pick the rest of centers
    while num_center < num_cluster:
        d = []

        for data_point in data_list:
            min_distance = sys.maxsize

            for center_point in center_list:
                center_point = center_point['dimensions']

                # calculate distance of each data-point to each center
                distance = distance_to_center(data_point, center_point)

                if distance < min_distance:
                    min_distance = distance

            d.append(min_distance)

        # pick one data-point as a center
        if pick_type == "linear":
            center_list.append(add_center(data_list[linear_pick(d)]))
        else:
            center_list.append(add_center(data_list[binary_pick(d)]))

        num_center += 1

    return center_list


# ----------------------------------------------------------------------------------------------------
def find_closest_center(data_list, center_list):
    cluster_result = {}

    for i, data_point in enumerate(data_list):
        center_index = None
        min_distance = sys.maxsize

        # find a center with minimal distance
        for j, center_point in enumerate(center_list):
            center_point = center_point['dimensions']

            distance = distance_to_center(data_point, center_point)

            if distance < min_distance:
                center_index = j
                min_distance = distance

        # assign data-point to the cluster
        center_list[center_index]['num_members'] += 1
        cluster_result[i] = center_index + 1

    return cluster_result


def update_cluster_center(data_list, cluster_result, center_list):
    # reset dimensions' value
    for c in center_list:
        c['dimensions'] = [0.0] * len(c['dimensions'])

    # sum of dimension values of a cluster center
    for di, cj in cluster_result.items():
        c = center_list[cj-1]['dimensions']

        for k in range(len(c)):
            c[k] += data_list[di][k]

    # reset center-info
    for c in center_list:
        c['dimensions'] = [float(i/c['num_members']) if c['num_members'] != 0 else 0.0 for i in c['dimensions']]
        c['num_members'] = 0

    return center_list


def calculate_square_error(data_list, cluster_result, center_list):
    square_error = 0

    for di, cj in cluster_result.items():
        data_point = data_list[di]
        center_point = center_list[cj-1]['dimensions']

        for a, b in zip(data_point, center_point):
            square_error += abs(a - b) ** 2

    return square_error


# ----------------------------------------------------------------------------------------------------
def clustering_data(data_list=None, num_cluster=2, num_iteration=100, initial_type="random", show_center_move=False):
    if data_list:
        # 1.initialize k-centers: random or k-means++
        print("[Msg][Init] Initialize cluster centers.")
        center_list = []

        if initial_type == "random":
            center_list = random_initialization(data_list, num_cluster)
        else:
            center_list = k_means_plusplus_initialization(data_list, num_cluster, "linear")

        # ----------------------------------------------------------------------------------------------------
        # clustering data
        cluster_result = {}
        square_error = sys.maxsize

        for i in range(num_iteration):
            # preserve old centers
            old_square_error = copy.copy(square_error)

            # 2.classify each to the closest center
            cluster_result = find_closest_center(data_list, center_list)

            # 3.update centers
            new_center = update_cluster_center(data_list, cluster_result, center_list)

            # calculate square-error
            square_error = calculate_square_error(data_list, cluster_result, center_list)

            # stop-condition: square-error is no more improving
            print("[Msg][Loop] Iteration {0}, square-error: {1:.2f}".format(i + 1, square_error))

            if show_center_move:
                visualize_result("centers-movement-{0}.png".format(i+1), data_list, cluster_result, center_list, False, True)

            if square_error == old_square_error:
                print("[Msg][Stop] Stop clustering, centers are stable!")
                return cluster_result, center_list
            else:
                # preserve related info.
                old_square_error = square_error
                center_list = copy.deepcopy(new_center)

        # stop by reaching maximal iterations
        print("[Msg] STOP clustering, reach maximal iterations!")
        return cluster_result, center_list
    else:
        print("[ERR][Msg] No data for clustering.")
        sys.exit(0)


# ----------------------------------------------------------------------------------------------------
def classifying_data(data_list=None, center_list=None):
    if data_list and center_list:
        return find_closest_center(data_list, center_list)
    else:
        print("[ERR][Msg] No data for classifying.")
        sys.exit(0)


# ----------------------------------------------------------------------------------------------------
def save_result(file_name="k-means_results.txt", data_list=None, cluster_result=None, center_list=None):
    if data_list and cluster_result and center_list:
        with open(file_name, "w") as f:
            # centers' info
            f.write("Centers\n")
            f.write("--------------------------------------------------\n")

            for i in range(len(center_list)):
                c = center_list[i]
                f.write("center-{0}: {1}\n".format(i+1, c['dimensions']))

            # data-points' cluster
            identified_cluster = []

            f.write("\n")
            f.write("Clusters\n")
            f.write("--------------------------------------------------\n")

            for i in sorted(cluster_result):
                f.write("{0}: {1}\n".format(i + 1, cluster_result[i]))
                identified_cluster.append(cluster_result[i])

            # NMI value: clustering accuracy
            true_cluster = [i[-1] for i in data_list]

            f.write("\n")
            f.write("Normalized Mutual Information (NMI) as accuracy\n")
            f.write("--------------------------------------------------\n")
            f.write("{0}\n".format(nmi(true_cluster, identified_cluster)))
    else:
        print("[ERR][Msg] No data to save.")
        sys.exit(0)


def visualize_result(file_name="k-means-results.png", data_list=None, cluster_result=None, center_list=None, image_show=False, image_save=False):
    if data_list and cluster_result and center_list:
        # plot parameters
        plot_marker_alpha = 0.75
        plot_marker_list = ['o', 'x', 'D', '8', 's', '^', 'v', 'H'] * len(center_list)
        plot_marker_size = 25
        plot_x_size = 6
        plot_y_size = 6
        plot_dpi = 300

        # prepare data
        cluster_dict = {}

        for i, c in cluster_result.items():
            x, y, tmp = data_list[i]

            if c in cluster_dict:
                cluster_dict[c]['x'].append(x)
                cluster_dict[c]['y'].append(y)
            else:
                cluster_dict[c] = {}
                cluster_dict[c]['x'] = [x]
                cluster_dict[c]['y'] = [y]

        # draw data figure
        fig, axes = plt.subplots(figsize=(plot_x_size, plot_y_size), facecolor='w')

        for c in sorted(cluster_dict):
            x = cluster_dict[c]['x']
            y = cluster_dict[c]['y']
            marker_style = plot_marker_list[c-1]
            axes.scatter(x, y, marker=marker_style, s=plot_marker_size, alpha=plot_marker_alpha)

        # draw centers
        for c in center_list:
            x, y = c['dimensions']
            axes.scatter(x, y, color="r", marker="*", s=plot_marker_size*2, alpha=plot_marker_alpha)

        # plot setting
        axes.axis(plot_display_axis_configuration(data_list))
        axes.xaxis.set_visible(False)
        axes.yaxis.set_visible(False)

        # save and show figure
        plt.tight_layout()

        if image_save:
            plt.savefig(file_name, dpi=plot_dpi, bbox_inches='tight', pad_inches=0.05)

        if image_show:
            plt.show()

        plt.close(fig)
    else:
        print("[ERR][Msg] No data to visualize.")


def k_means_clustering(filename_prefix="2d-data", num_cluster=2):
    print(">>> K-means clustering")
    print()

    # clustering training data
    # ----------------------------------------------------------------------------------------------------
    print("[Msg] Clustering the training data.")
    print("[Msg] Load training data")
    train_data = load_data(file_name="{0}-train.txt".format(filename_prefix))

    # k-means clustering
    print("[Msg] Clustering training data.")
    cluster_result, center_list = clustering_data(train_data, num_cluster, initial_type="k-means++", show_center_move=True)

    # save clustering results
    print("[Msg] Save clustering result")
    save_result("k-means-train-results.txt", train_data, cluster_result, center_list)

    # visualize clustering results
    print("[Msg] Visualize clustering result.")
    visualize_result("k-means-train-results.png", train_data, cluster_result, center_list, False, True)

    # classifying testing data
    # ----------------------------------------------------------------------------------------------------
    print()
    print("[Msg] Classifying the testing data.")
    print("[Msg] Load testing data.")
    test_data = load_data(file_name="{0}-test.txt".format(filename_prefix))

    # k-classifying
    print("[Msg] Classifying testing data.")
    classify_result = classifying_data(test_data, center_list)

    print("[Msg] Save classifying result")
    save_result("k-means-test-results.txt", test_data, classify_result, center_list)

    print("[Msg] Visualize classifying result.")
    visualize_result("k-means-test-results.png", test_data, classify_result, center_list, False, True)

    print()
    print(">>> STOP K-means clustering")


if __name__ == "__main__":
    k_means_clustering(filename_prefix="2d-data", num_cluster=3)
訓練資料的分群結果:
- 參考檔案: k-means-train-results.txt
Centers
--------------------------------------------------
center-1: [5.1680711449639976, 4.930908880262219]
center-2: [-4.885116286698693, -5.173046820775724]
center-3: [-0.25568822278366576, -0.033045844275341185]

Clusters
--------------------------------------------------
1: 2
2: 2
3: 2
4: 2
5: 2
6: 2
7: 2
8: 2
9: 2
10: 2
11: 2
12: 2
13: 2
14: 2
15: 2
16: 2
17: 2
18: 2
19: 2
20: 2
21: 2
22: 2
23: 2
24: 2
25: 2
26: 2
27: 2
28: 2
29: 2
30: 2
31: 2
32: 2
33: 2
34: 2
35: 2
36: 2
37: 2
38: 2
39: 2
40: 2
41: 2
42: 2
43: 2
44: 2
45: 2
46: 2
47: 2
48: 2
49: 2
50: 2
51: 3
52: 3
53: 3
54: 3
55: 3
56: 3
57: 3
58: 3
59: 3
60: 3
61: 3
62: 3
63: 3
64: 3
65: 3
66: 3
67: 3
68: 3
69: 2
70: 3
71: 3
72: 3
73: 3
74: 3
75: 3
76: 3
77: 1
78: 3
79: 3
80: 3
81: 3
82: 3
83: 3
84: 3
85: 3
86: 3
87: 3
88: 3
89: 3
90: 3
91: 3
92: 3
93: 3
94: 3
95: 3
96: 3
97: 3
98: 3
99: 3
100: 3
101: 1
102: 1
103: 1
104: 1
105: 1
106: 1
107: 3
108: 1
109: 1
110: 1
111: 1
112: 1
113: 1
114: 1
115: 1
116: 1
117: 1
118: 1
119: 1
120: 1
121: 1
122: 1
123: 1
124: 1
125: 1
126: 1
127: 1
128: 1
129: 1
130: 1
131: 1
132: 1
133: 1
134: 1
135: 1
136: 1
137: 1
138: 1
139: 1
140: 1
141: 1
142: 1
143: 1
144: 1
145: 1
146: 1
147: 1
148: 1
149: 1
150: 1

Normalized Mutual Information (NMI) as accuracy
--------------------------------------------------
0.9108187069198481

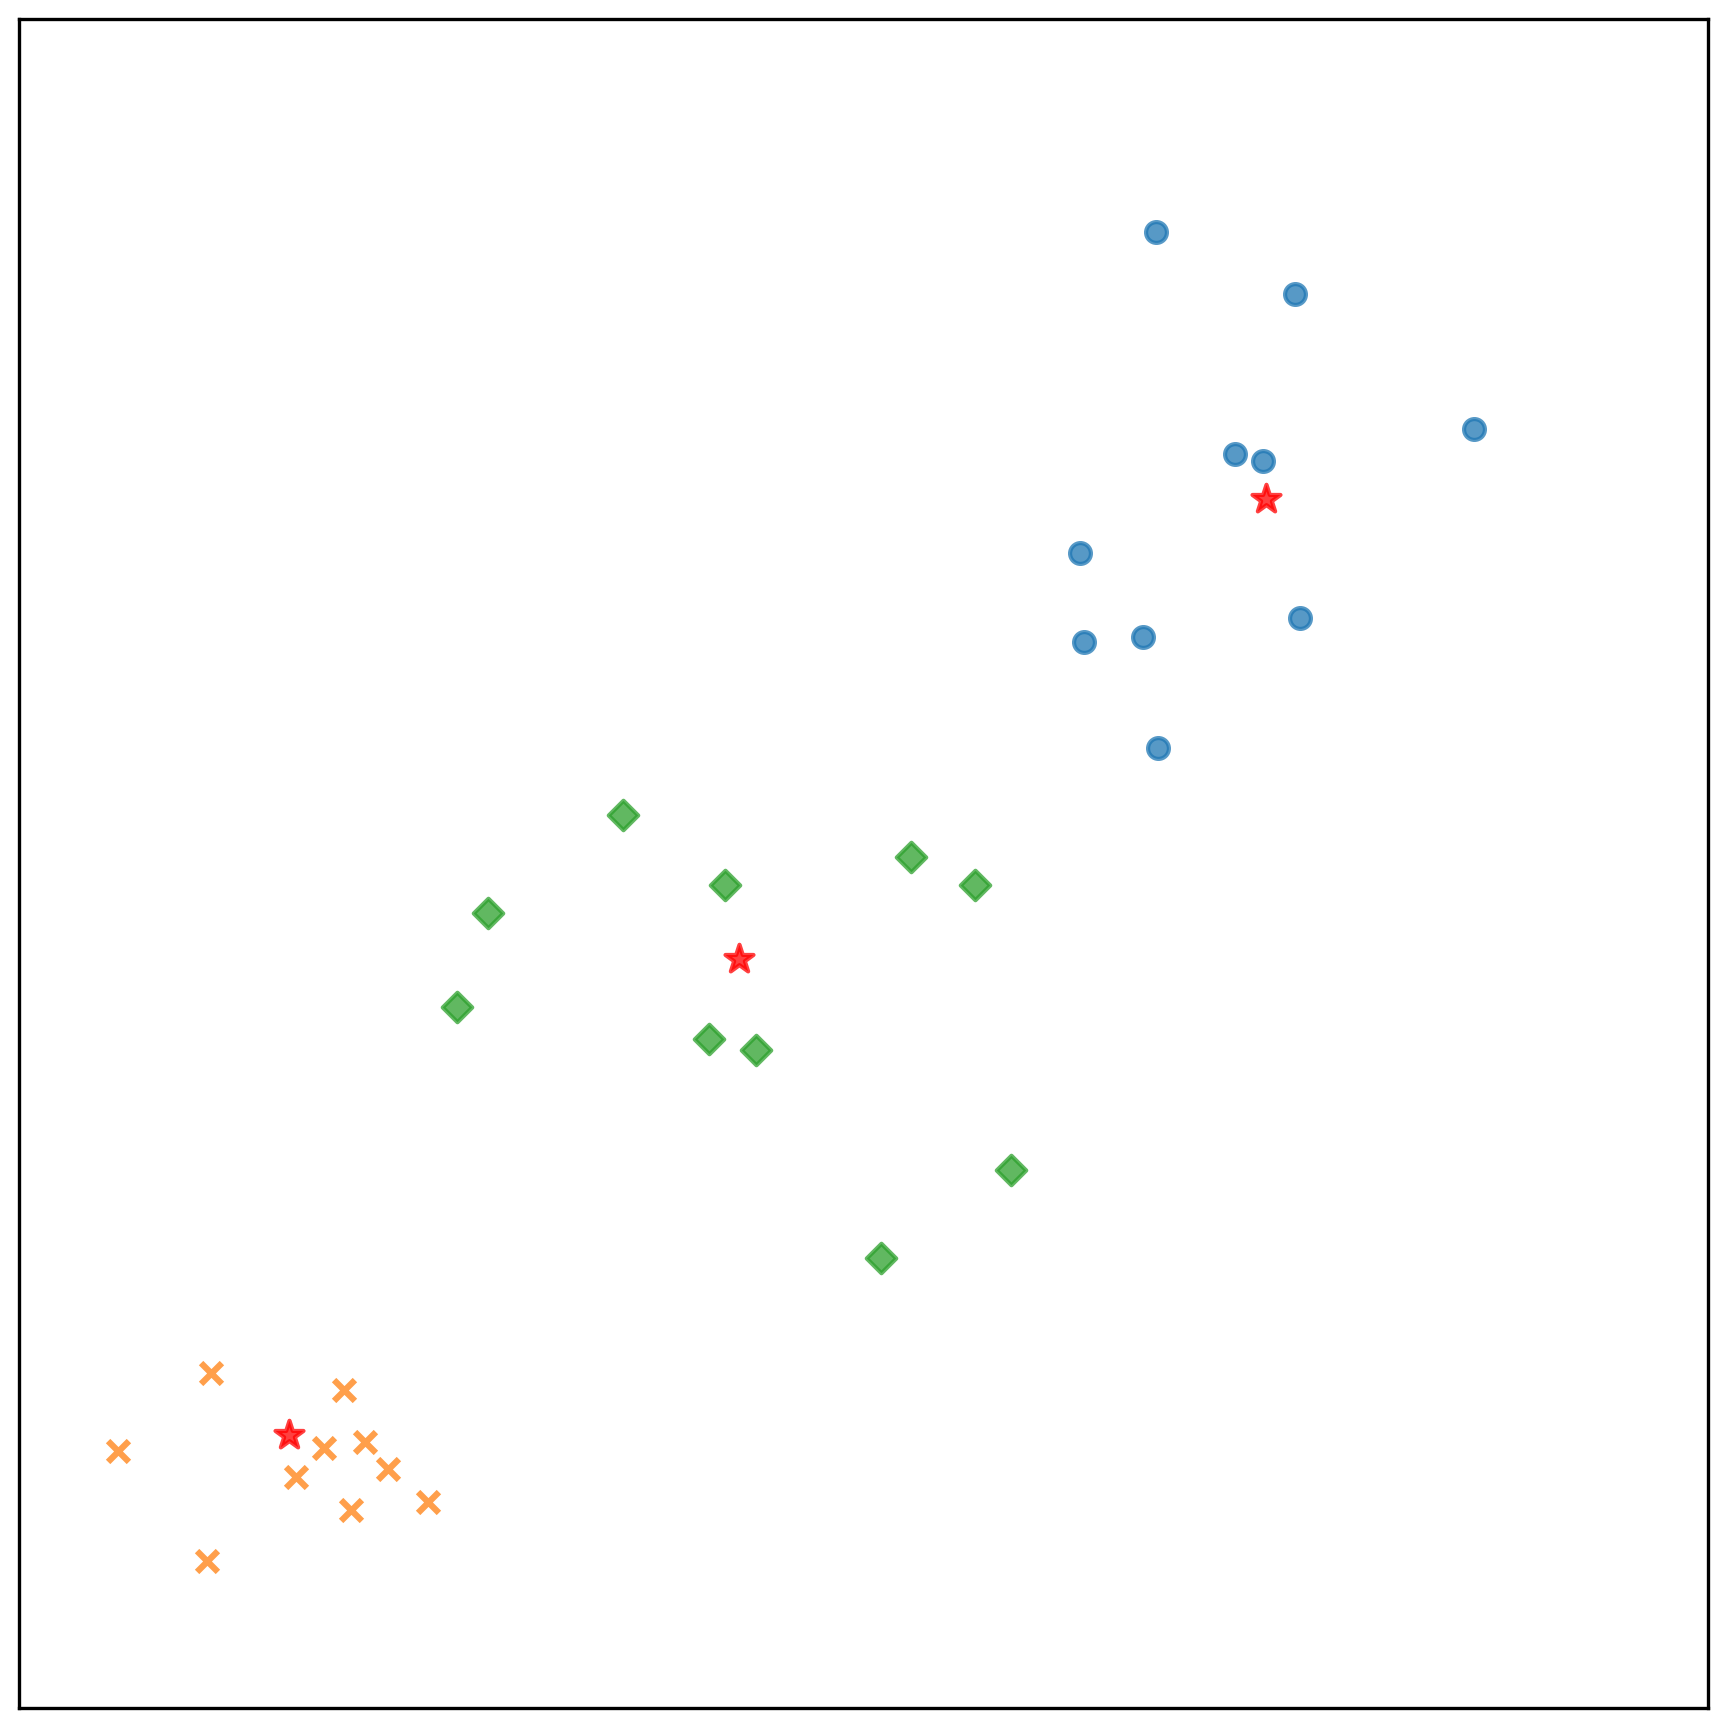
中心點的收斂情況:
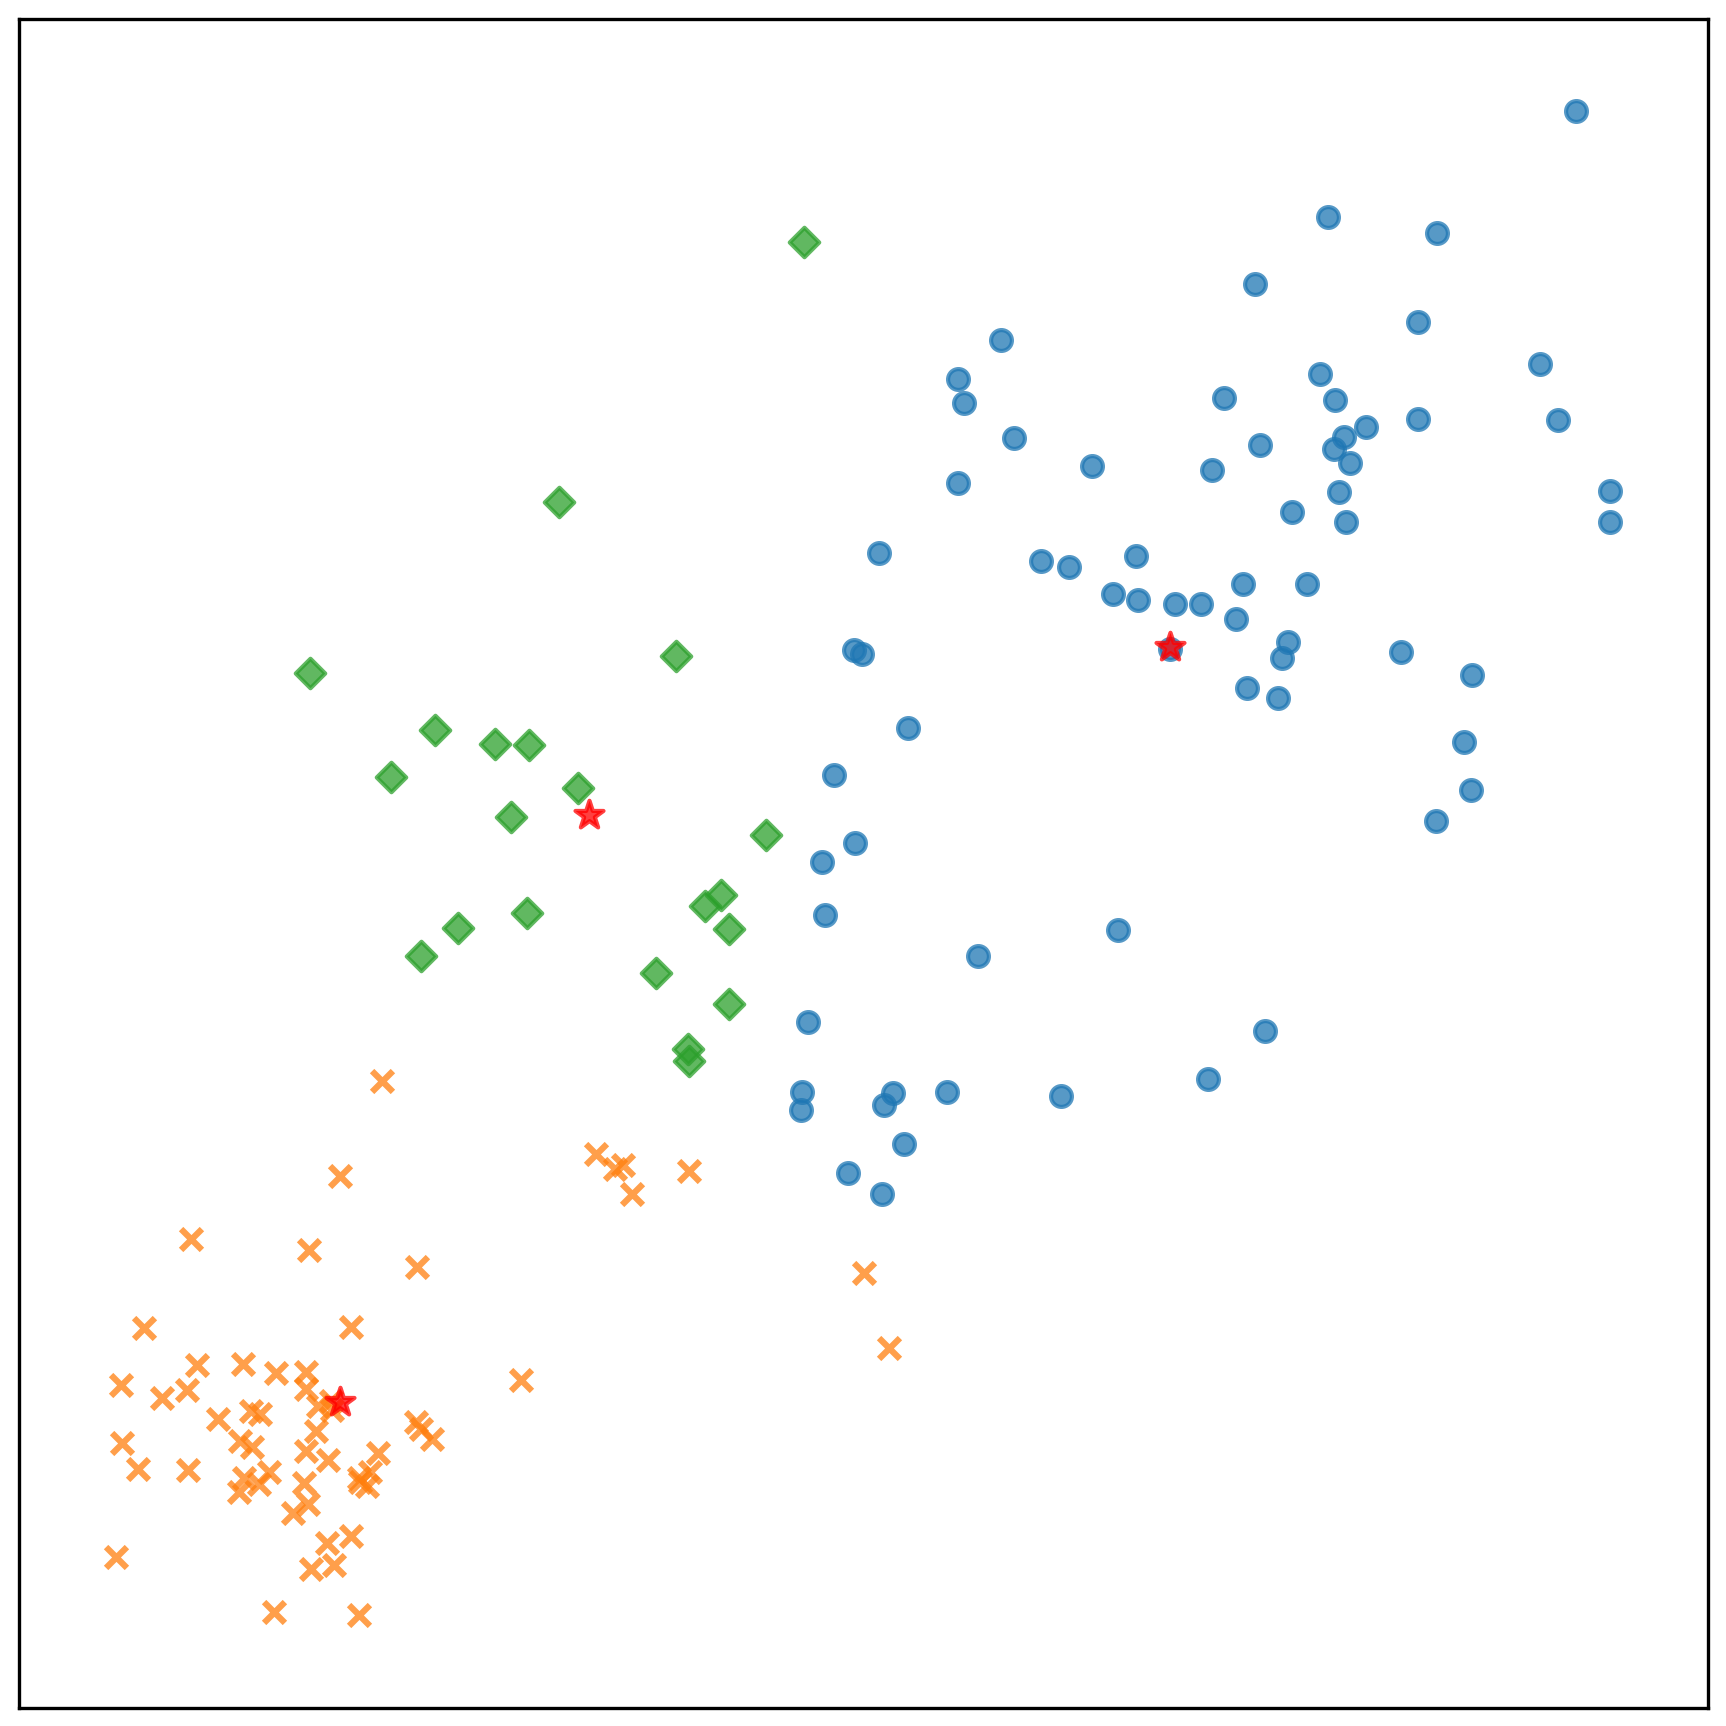
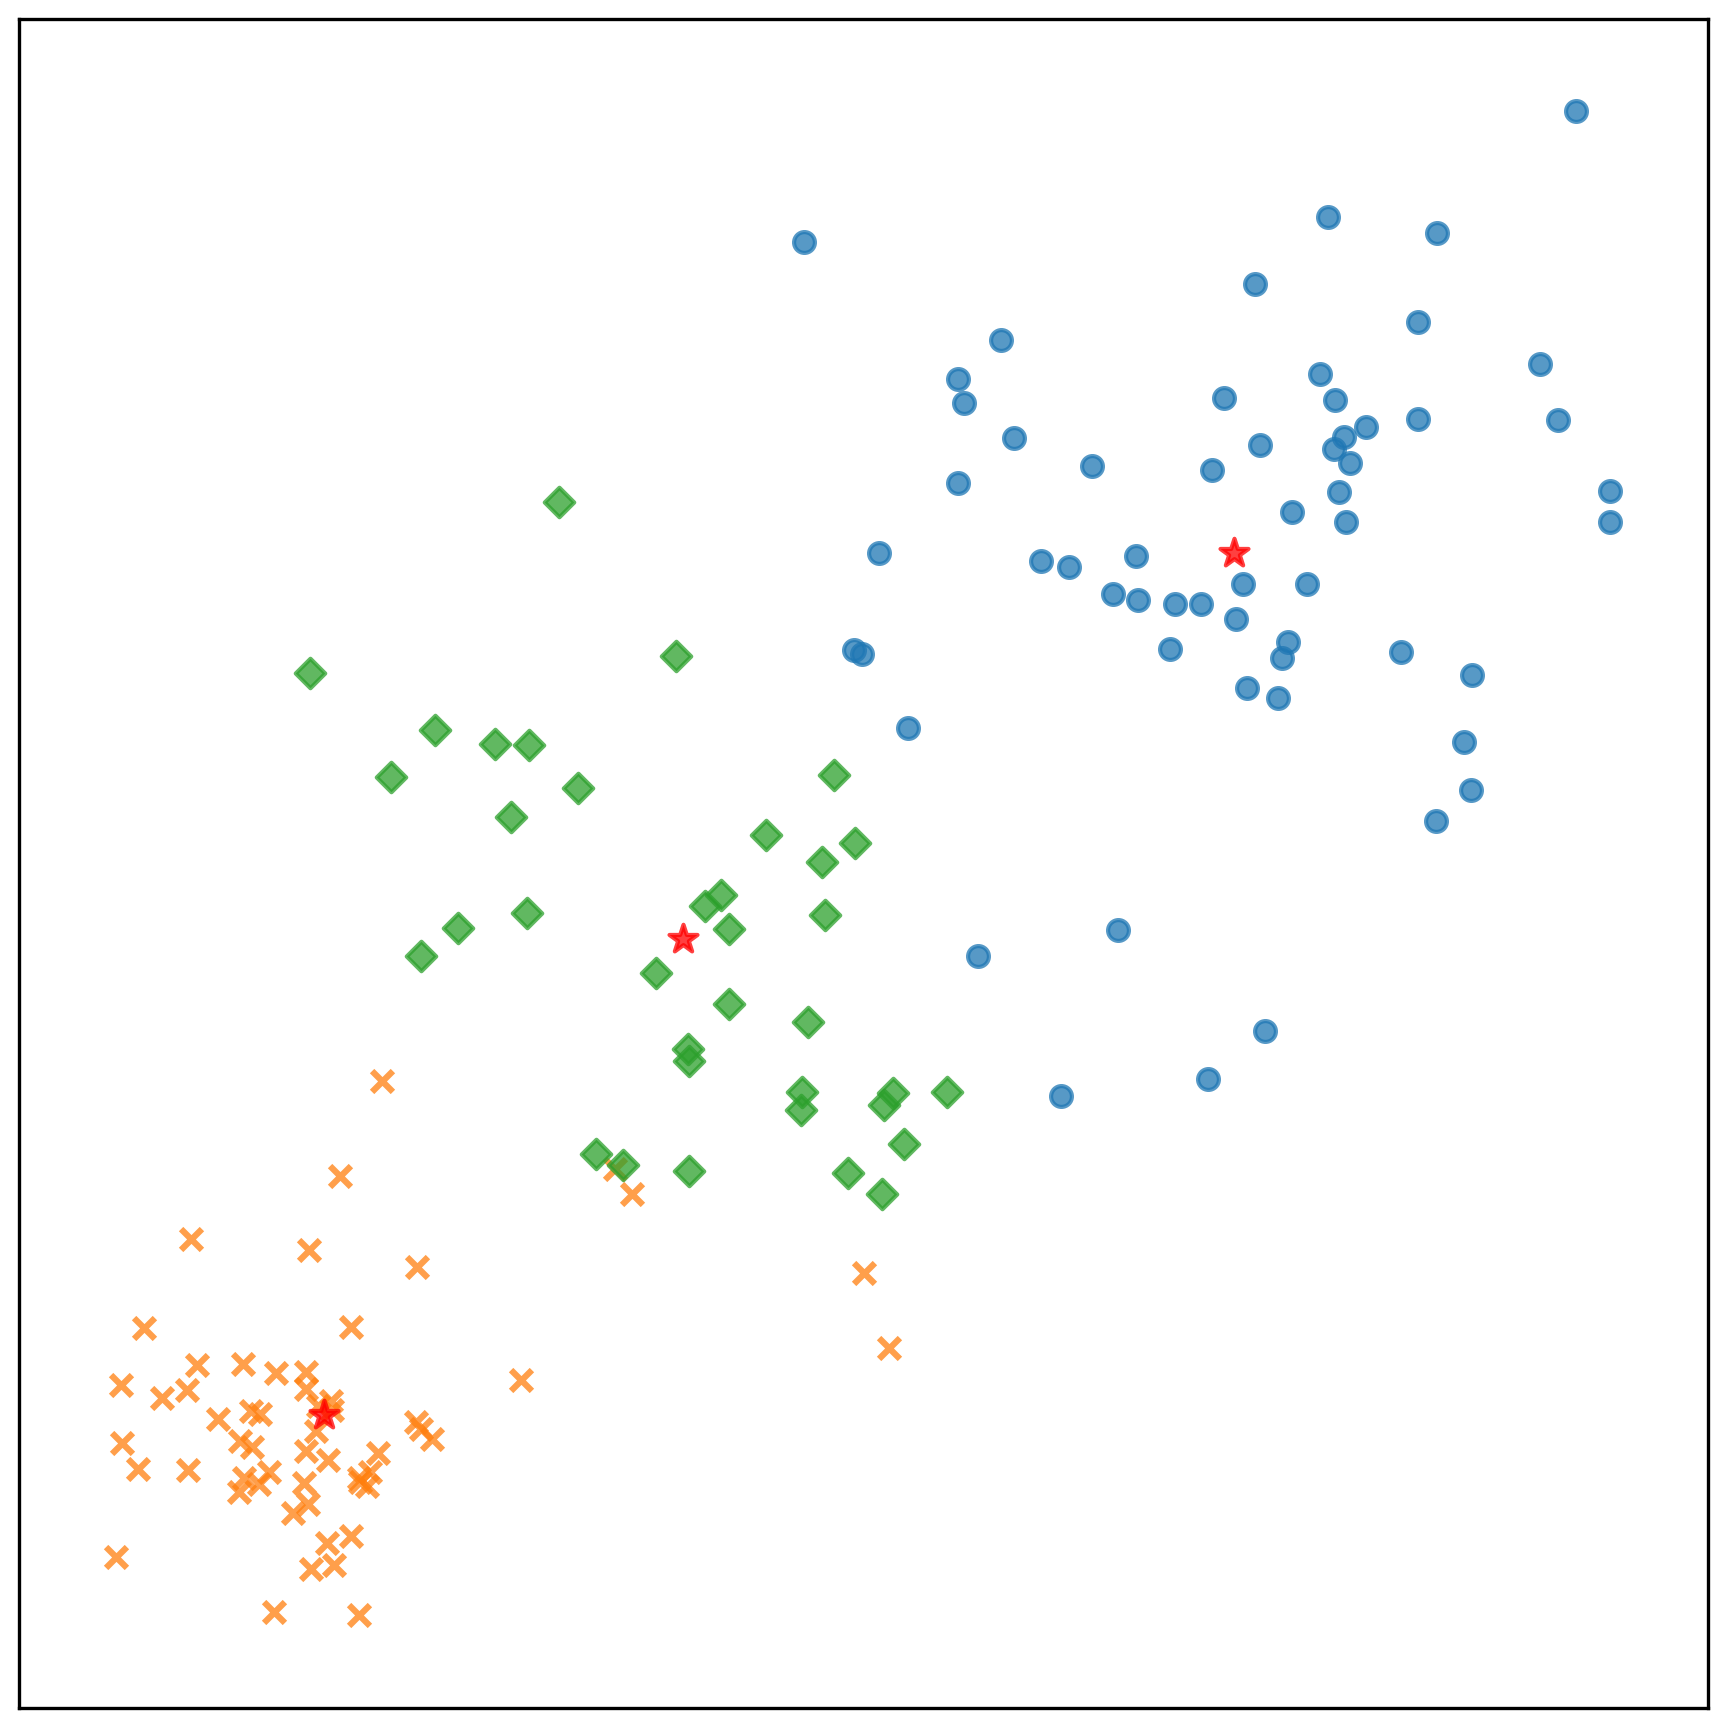
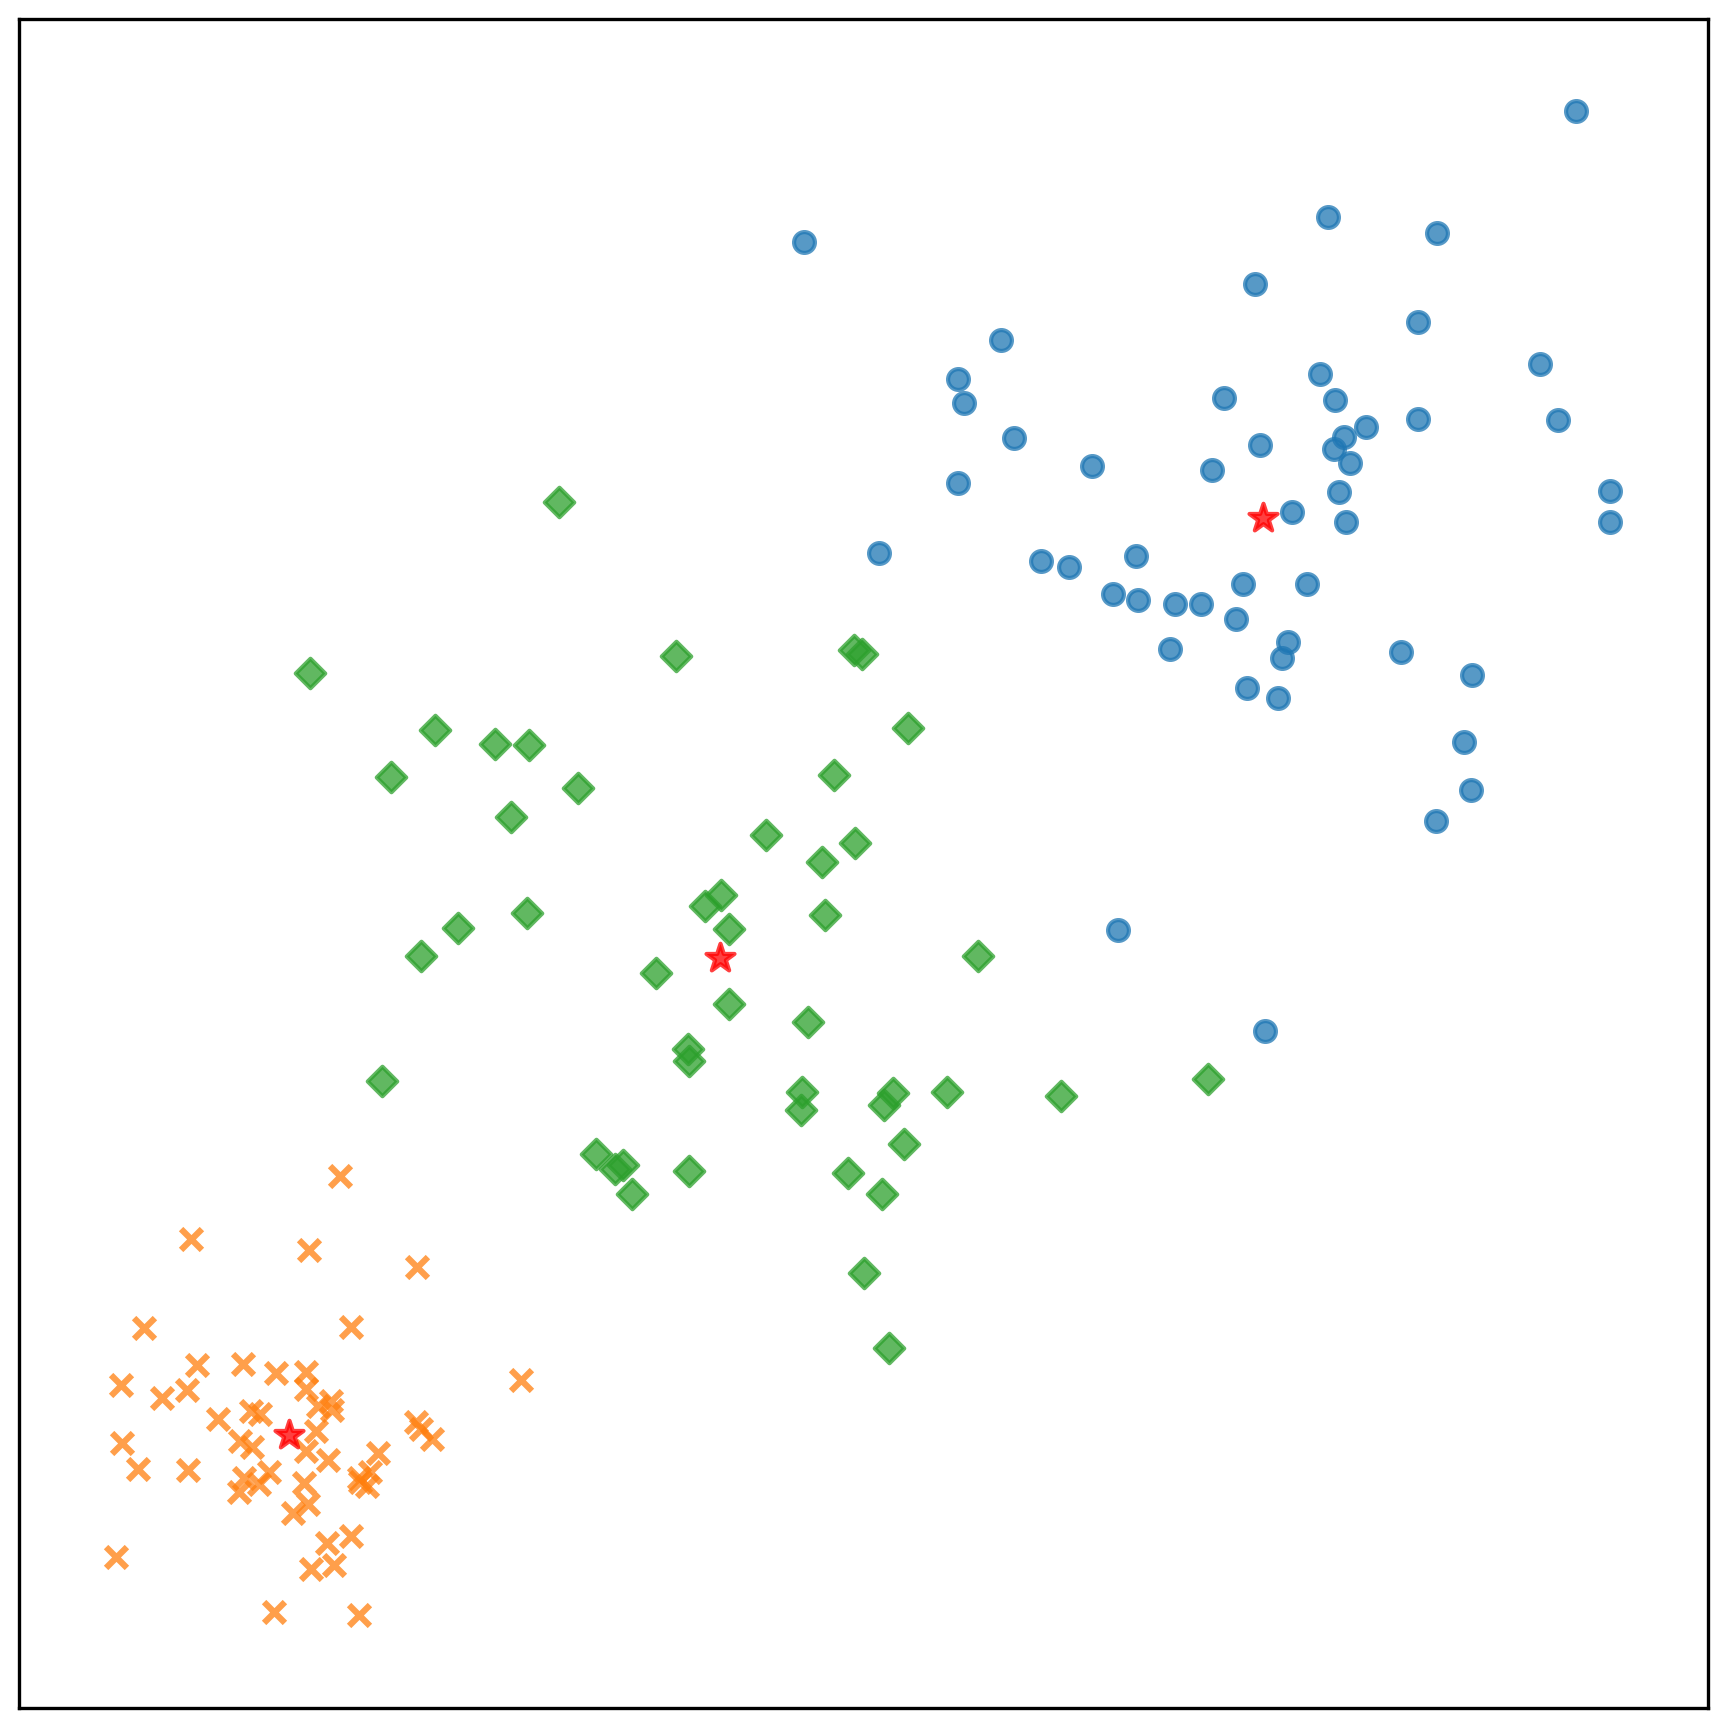
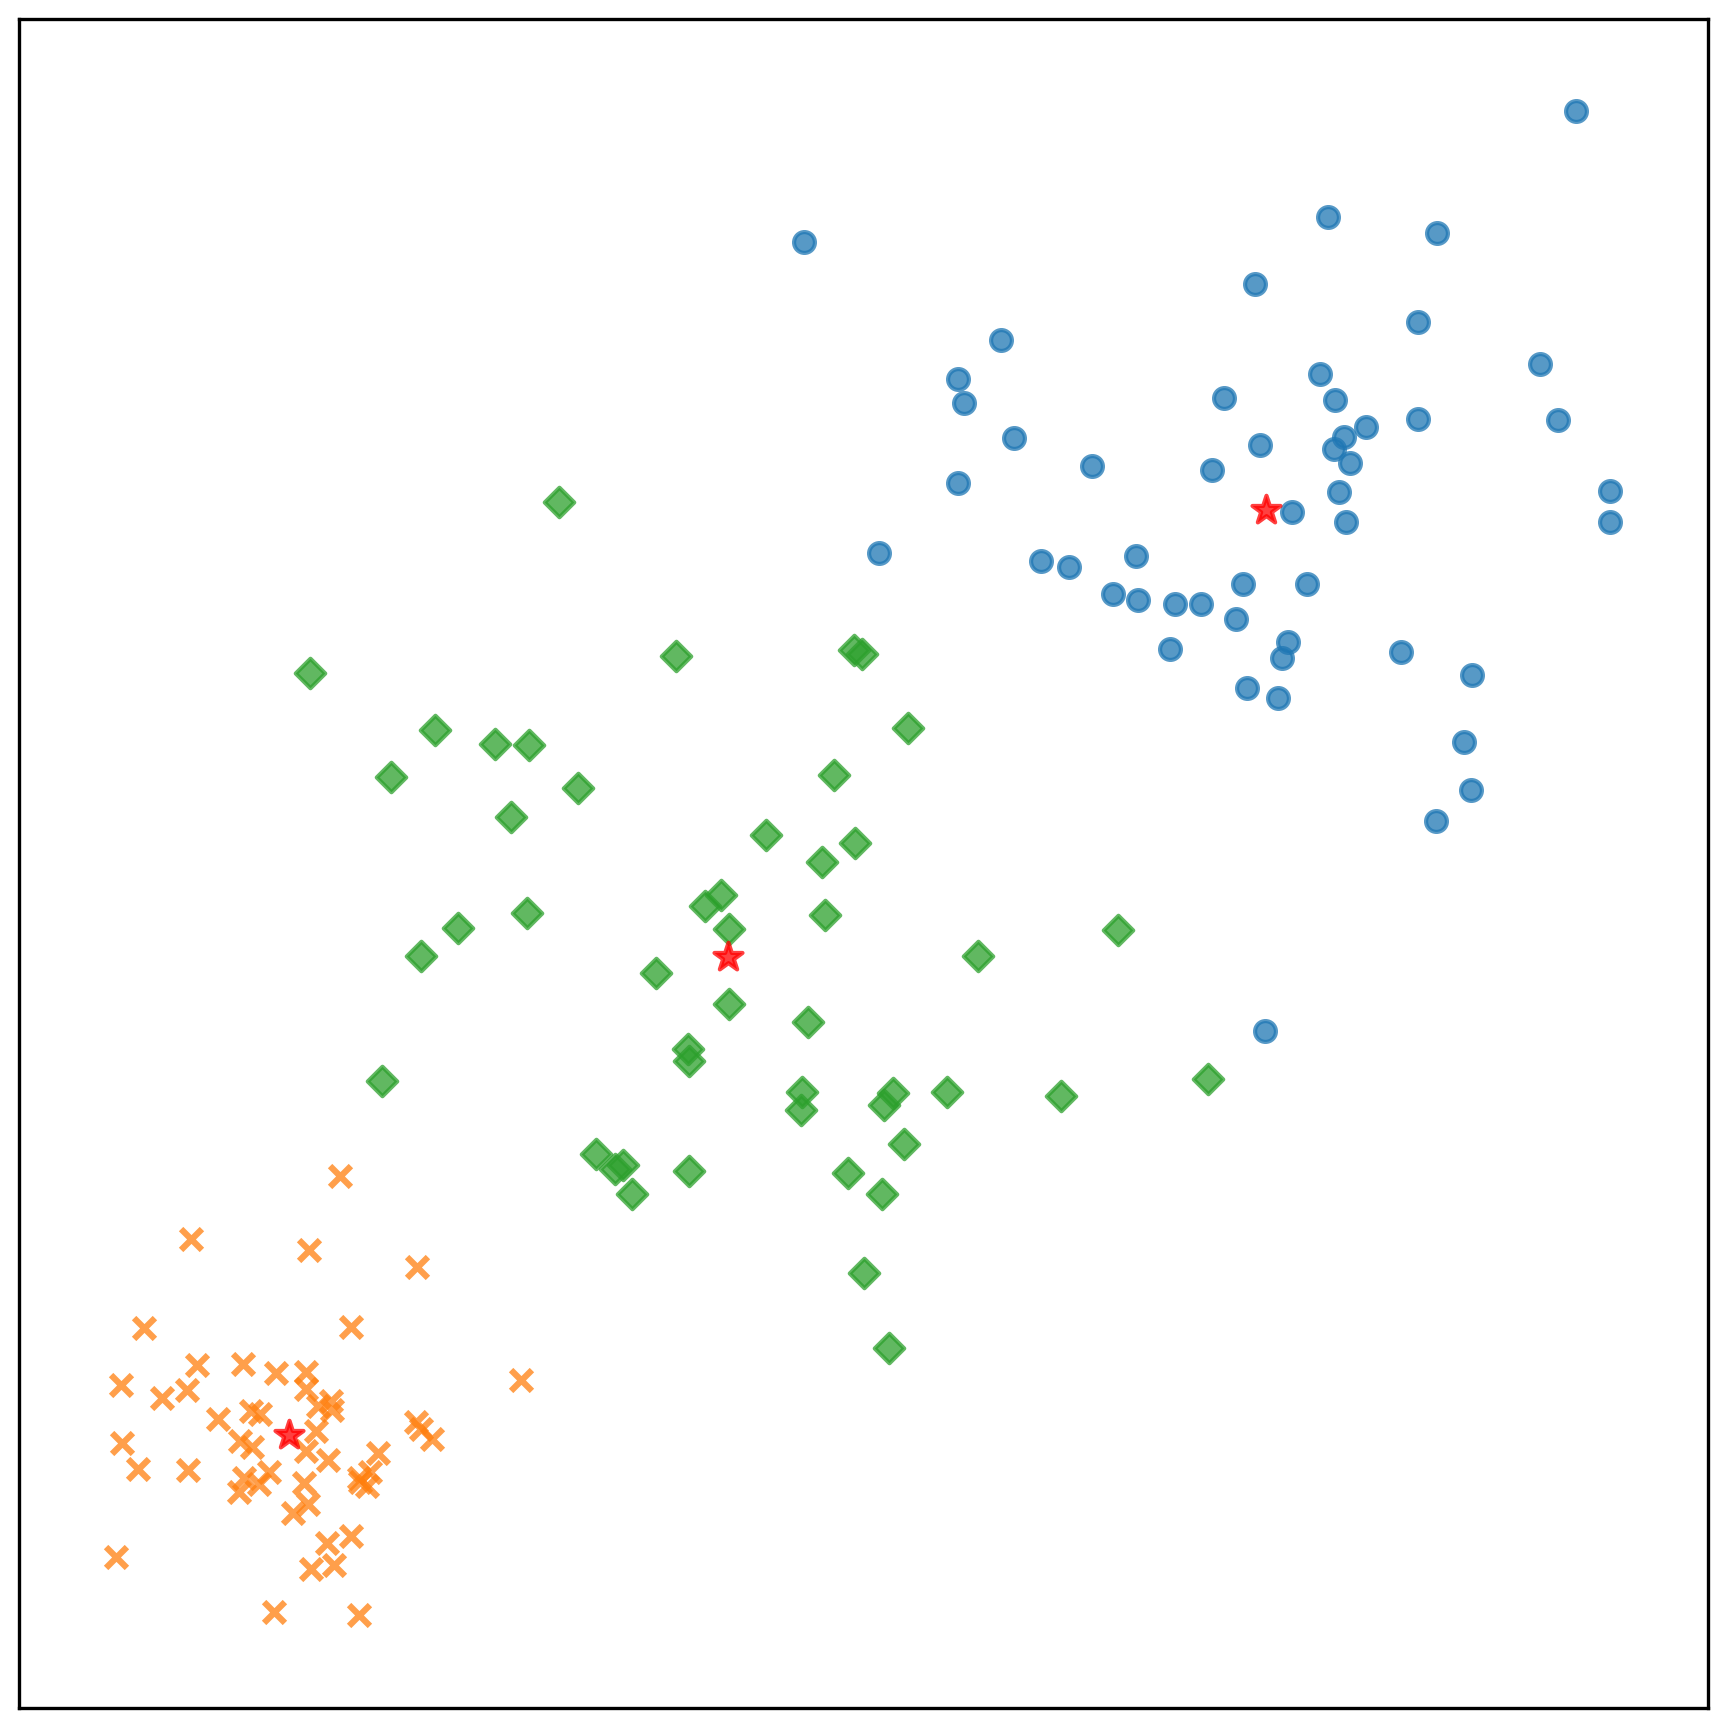


測試資料的分類結果:
- 參考檔案: k-means-test-results.txt
Centers
--------------------------------------------------
center-1: [5.1680711449639976, 4.930908880262219]
center-2: [-4.885116286698693, -5.173046820775724]
center-3: [-0.25568822278366576, -0.033045844275341185]

Clusters
--------------------------------------------------
1: 2
2: 2
3: 2
4: 2
5: 2
6: 2
7: 2
8: 2
9: 2
10: 2
11: 3
12: 3
13: 3
14: 3
15: 3
16: 3
17: 3
18: 3
19: 3
20: 3
21: 1
22: 1
23: 1
24: 1
25: 1
26: 1
27: 1
28: 1
29: 1
30: 1

Normalized Mutual Information (NMI) as accuracy
--------------------------------------------------
1.0
參考資料
- Introduction to K-means Clustering
- Improved Seeding For Clustering With K-Means++
- K-Means Clustering
- K-means 演算法
- K-means、K-means++和K-NN算法比較
- K-means 聚類算法的三種改進(K-means ++,ISODATA,Kernel均值)介紹與對比
- K-Means++ 算法
- Test Run - K-Means++ Data Clustering
- Wikipedia - k-means clustering
- 簡單易學的機器學習算法 - K均值++算法
- 浅入浅出:從K-means到K-means++