Ana4.1 K-NN分類實作
在此節中實作 K-Nearest Neighbor (K-NN) 分類演算法。
首先,使用窮舉或暴力 (Brute Force) 法實作 K-NN 分類演算法的細節內容如下:
# 每一個測試資料點,計算它跟其他所有訓練或目標資料的距離
# 找出距離最近的k個資料點
# 找出k個資料點中為多數的類別標籤(class label)
# 將類別標籤指定給此測試資料點
由於,使用暴力法實作 K-NN 分類演算法,在訓練或目標資料量大時,其程式的效能會降低。所以,若需要改善其效能時,可以改用Ball-Tree或KD-Tree來實作。
接者,分類程式的概念流程如下:
# 顯示開始訊息

# 讀「取訓」練或目標資料

# 讀取「測試」資料
# 對「測試」資料做K-NN分類
# 儲存「測試」資料的分類結果
# 顯示「測試」資料的分類結果

# 顯示結束訊息
- 參考檔案: k-nn.py
# coding=utf-8
# 匯入模組
import bisect
import copy
import math
import matplotlib.pyplot as plt
import random
import sys

from collections             import Counter
from sklearn.metrics.cluster import normalized_mutual_info_score as nmi


# 定義變數
PLOT_DISPLAY_AXIS = []


# 定義函數
def load_data(file_name=""):
    if file_name:
        data_list = []

        with open(file_name, "r") as f:
            for s in f.readlines():
                s = s.strip(" \t\r\n").split(",")
                s = [float(i) for i in s[0:len(s)-1]] + [int(s[-1])]
                data_list.append(s)

        return data_list
    else:
        print("[Err][Msg] No data to read.")


def plot_display_axis_configuration(data_list):
    global PLOT_DISPLAY_AXIS

    if not PLOT_DISPLAY_AXIS:
        x_max = -sys.maxsize
        y_max = -sys.maxsize
        x_min = sys.maxsize
        y_min = sys.maxsize

        for x, y, c in data_list:
            if x > x_max:
                x_max = copy.copy(x)
            if x < x_min:
                x_min = copy.copy(x)
            if y > y_max:
                y_max = copy.copy(y)
            if y < y_min:
                y_min = copy.copy(y)

        PLOT_DISPLAY_AXIS = [x_min-1, x_max+1, y_min-1, y_max+1]
    else:
        pass

    return PLOT_DISPLAY_AXIS


# ----------------------------------------------------------------------------------------------------
def calculate_two_points(data_point_i, data_point_j, _lambda=1, sqrt=math.sqrt):
    distance = 0.0

    for a, b in zip(data_point_i, data_point_j):
        distance += pow(abs(a - b), _lambda)

    return sqrt(distance)


# ----------------------------------------------------------------------------------------------------
def classifying_data(train_data=None, test_data=None, num_k=5):
    if train_data and test_data:
        classify_result = {}
        num_dimension = len(train_data[0]) - 1

        # calculate distance of each test-data to train-data
        for i, data_point_i in enumerate(test_data):
            dp_i = data_point_i[0: num_dimension]
            nn_list = []

            for j, data_point_j in enumerate(train_data):
                dp_j = data_point_j[0:num_dimension]
                distance = calculate_two_points(dp_i, dp_j)

                nn_list.append([data_point_j[num_dimension], distance])

            # sort by distance
            cluster_list = [c for c, d in sorted(nn_list, key=lambda x:x[1])[0: num_k]]

            # find most common cluster
            cluster_label = Counter(cluster_list).most_common(1)[0][0]
            classify_result[i] = cluster_label

        return classify_result
    else:
        print("[ERR][Msg] No data for classifying.")
        sys.exit(0)


# ----------------------------------------------------------------------------------------------------
def save_result(file_name="k-nn-results.png", data_list=None, cluster_result=None):
    if data_list and cluster_result:
        with open(file_name, "w") as f:
            # data-points' cluster
            f.write("Clusters\n")
            f.write("--------------------------------------------------\n")
            identified_cluster = []
            for i in sorted(cluster_result):
                f.write("{0}: {1}\n".format(i + 1, cluster_result[i]))
                identified_cluster.append(cluster_result[i])

            # NMI value: clustering accuracy
            true_cluster = [i[-1] for i in data_list]
            f.write("\n")
            f.write("Normalized Mutual Information (NMI) as accuracy\n")
            f.write("--------------------------------------------------\n")
            f.write("{0}\n".format(nmi(true_cluster, identified_cluster)))
    else:
        print("[ERR][Msg] No data to save.")
        sys.exit(0)


def visualize_result(file_name="k-nn-results.png", data_list=None, cluster_result=None, image_show=False, image_save=False):
    if data_list and cluster_result:
        # plot parameters
        plot_marker_alpha = 0.8
        plot_marker_list = ['o', 'x', 'D', '8', 's', '^', 'v', 'H'] * len(set(cluster_result.values()))
        plot_marker_size = 25
        plot_x_size = 6
        plot_y_size = 6
        plot_dpi = 300

        # prepare data
        cluster_dict = {}

        for i in cluster_result:
            x, y, c = data_list[i]
            c = cluster_result[i]

            if c in cluster_dict:
                cluster_dict[c]['x'].append(x)
                cluster_dict[c]['y'].append(y)
            else:
                cluster_dict[c] = {}
                cluster_dict[c]['x'] = [x]
                cluster_dict[c]['y'] = [y]

        # draw data figure
        fig, axes = plt.subplots(figsize=(plot_x_size, plot_y_size), facecolor='w')

        for c in cluster_dict:
            x = cluster_dict[c]['x']
            y = cluster_dict[c]['y']
            marker_style = plot_marker_list[c-1]
            axes.scatter(x, y, marker=marker_style, s=plot_marker_size, alpha=plot_marker_alpha)

        # plot setting
        axes.axis(plot_display_axis_configuration(data_list))
        axes.xaxis.set_visible(False)
        axes.yaxis.set_visible(False)

        # save and show figure
        plt.tight_layout()

        if image_save:
            plt.savefig(file_name, dpi=plot_dpi, bbox_inches='tight', pad_inches=0.05)

        if image_show:
            plt.show()

        plt.close(fig)
    else:
        print("[ERR][Msg] No data to visualize.")


def k_nn_classifying(filename_prefix="2d-data", num_k=5):
    print(">>> K-NN classifying")
    print()

    # load training data
    # ----------------------------------------------------------------------------------------------------
    print("[Msg] Classifying the testing data.")
    print("[Msg] Load training data as samples of nearest neighbors")
    train_data = load_data(file_name="{0}-train.txt".format(filename_prefix))

    # print("[Msg] Visualize samples of training data.")
    # cluster_result = {i:d[len(d)-1] for i, d in enumerate(train_data)}
    # visualize_result("k-nn-sample.png", train_data, cluster_result, False, True)

    # classifying testing data
    # ----------------------------------------------------------------------------------------------------
    print()
    print("[Msg] Classifying the testing data.")
    print("[Msg] Load testing data.")
    test_data = load_data(file_name="{0}-test.txt".format(filename_prefix))

    # k-classifying
    print("[Msg] Classifying testing data.")
    classify_result = classifying_data(train_data, test_data, num_k)

    print("[Msg] Save classifying result")
    save_result("k-nn-classify-results.txt", test_data, classify_result)

    print("[Msg] Visualize classifying result.")
    visualize_result("k-nn-classify-results.png", test_data, classify_result, False, True)

    print()
    print(">>> STOP K-NN classifying")


if __name__ == "__main__":
    k_nn_classifying(filename_prefix="2d-data", num_k=5)
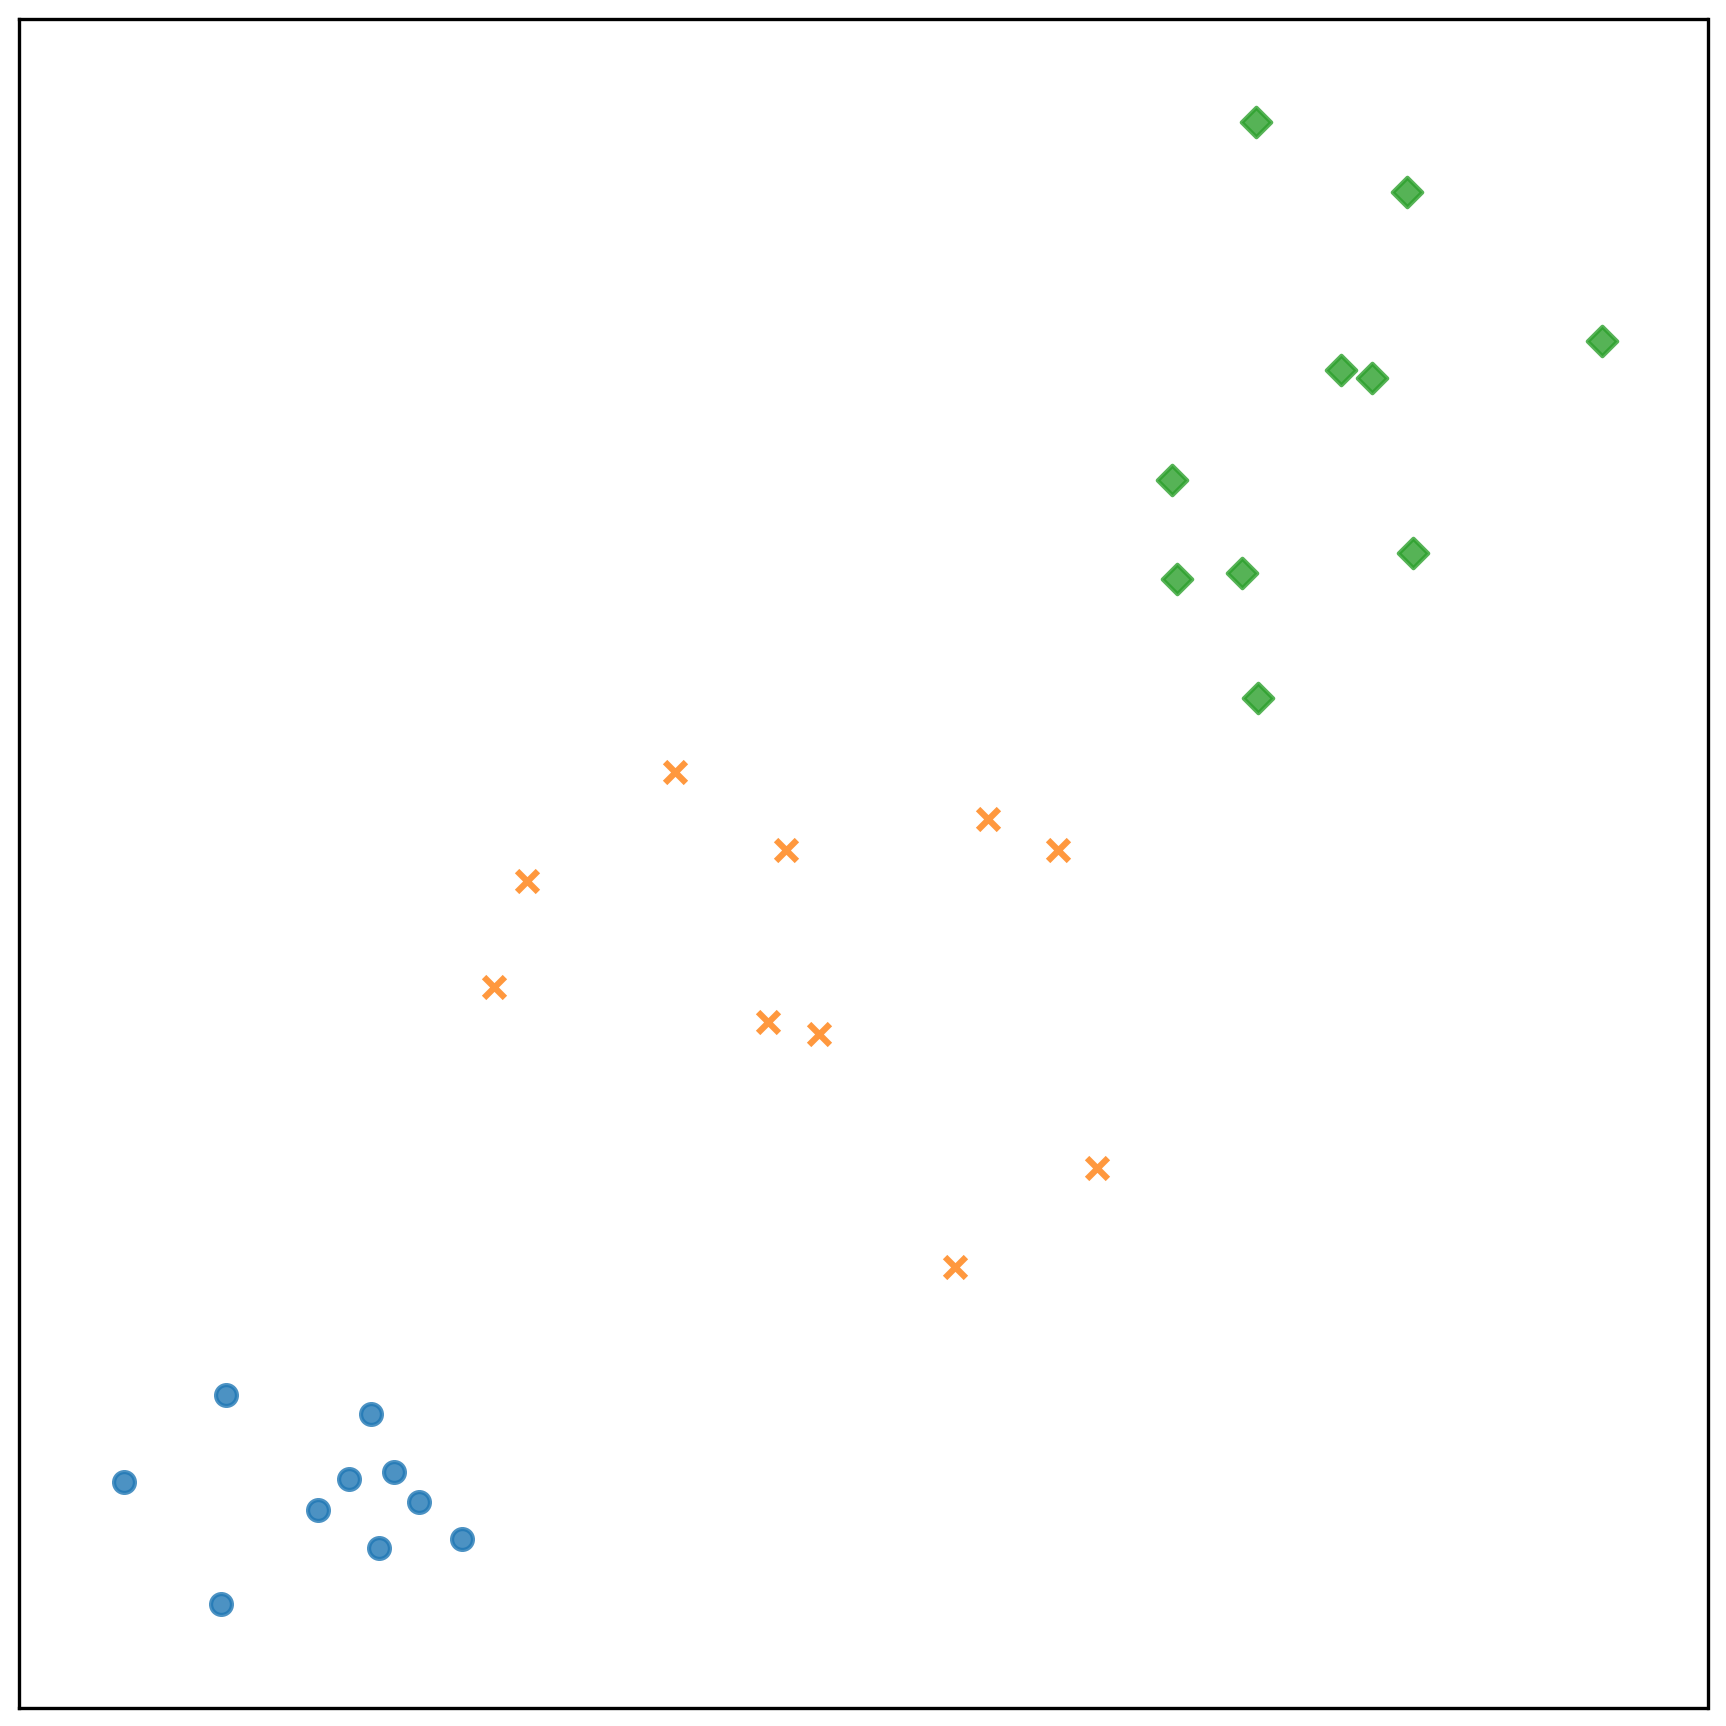
測試資料的分類結果:
- 參考檔案: k-nn-classify-results.txt
Clusters
--------------------------------------------------
1: 1
2: 1
3: 1
4: 1
5: 1
6: 1
7: 1
8: 1
9: 1
10: 1
11: 2
12: 2
13: 2
14: 2
15: 2
16: 2
17: 2
18: 2
19: 2
20: 2
21: 3
22: 3
23: 3
24: 3
25: 3
26: 3
27: 3
28: 3
29: 3
30: 3

Normalized Mutual Information (NMI) as accuracy
--------------------------------------------------
1.0
 參考資料
參考資料