Ana5.1 建立網絡
在此節中實作一個產生圖 (graph) 或網絡 (network) 資料的程式,其結果可以應用在後續的網絡節點分析及分群實作中。
安裝模組
使用 pip 安裝檔安裝相關模組。
pip install networkx
pip install PTable
安裝 Force-Atlas 2 graph layout 模組。
1.下載 forceatlas.py
2.置於欲使用程式之資料夾
3.使用 import 關鍵字匯入此模組
建立網絡之程式的概念流程如下:
# 顯示開始訊息

# 建立Karate網絡
# 讀取此網絡的真實分群
# 設定圖形變數
# 產生此網絡的layout資訊
# 建立圖形
# 繪製圖形
# 儲存及顯示圖形
# 儲存此網絡的相關資訊到pickle檔中

# 顯示結束訊息
- 參考檔案: karate_graph_generator.py
print(">>> Karate graph generator")
print()
# create the Karate network
print("[Msg] Create the Karate network.")
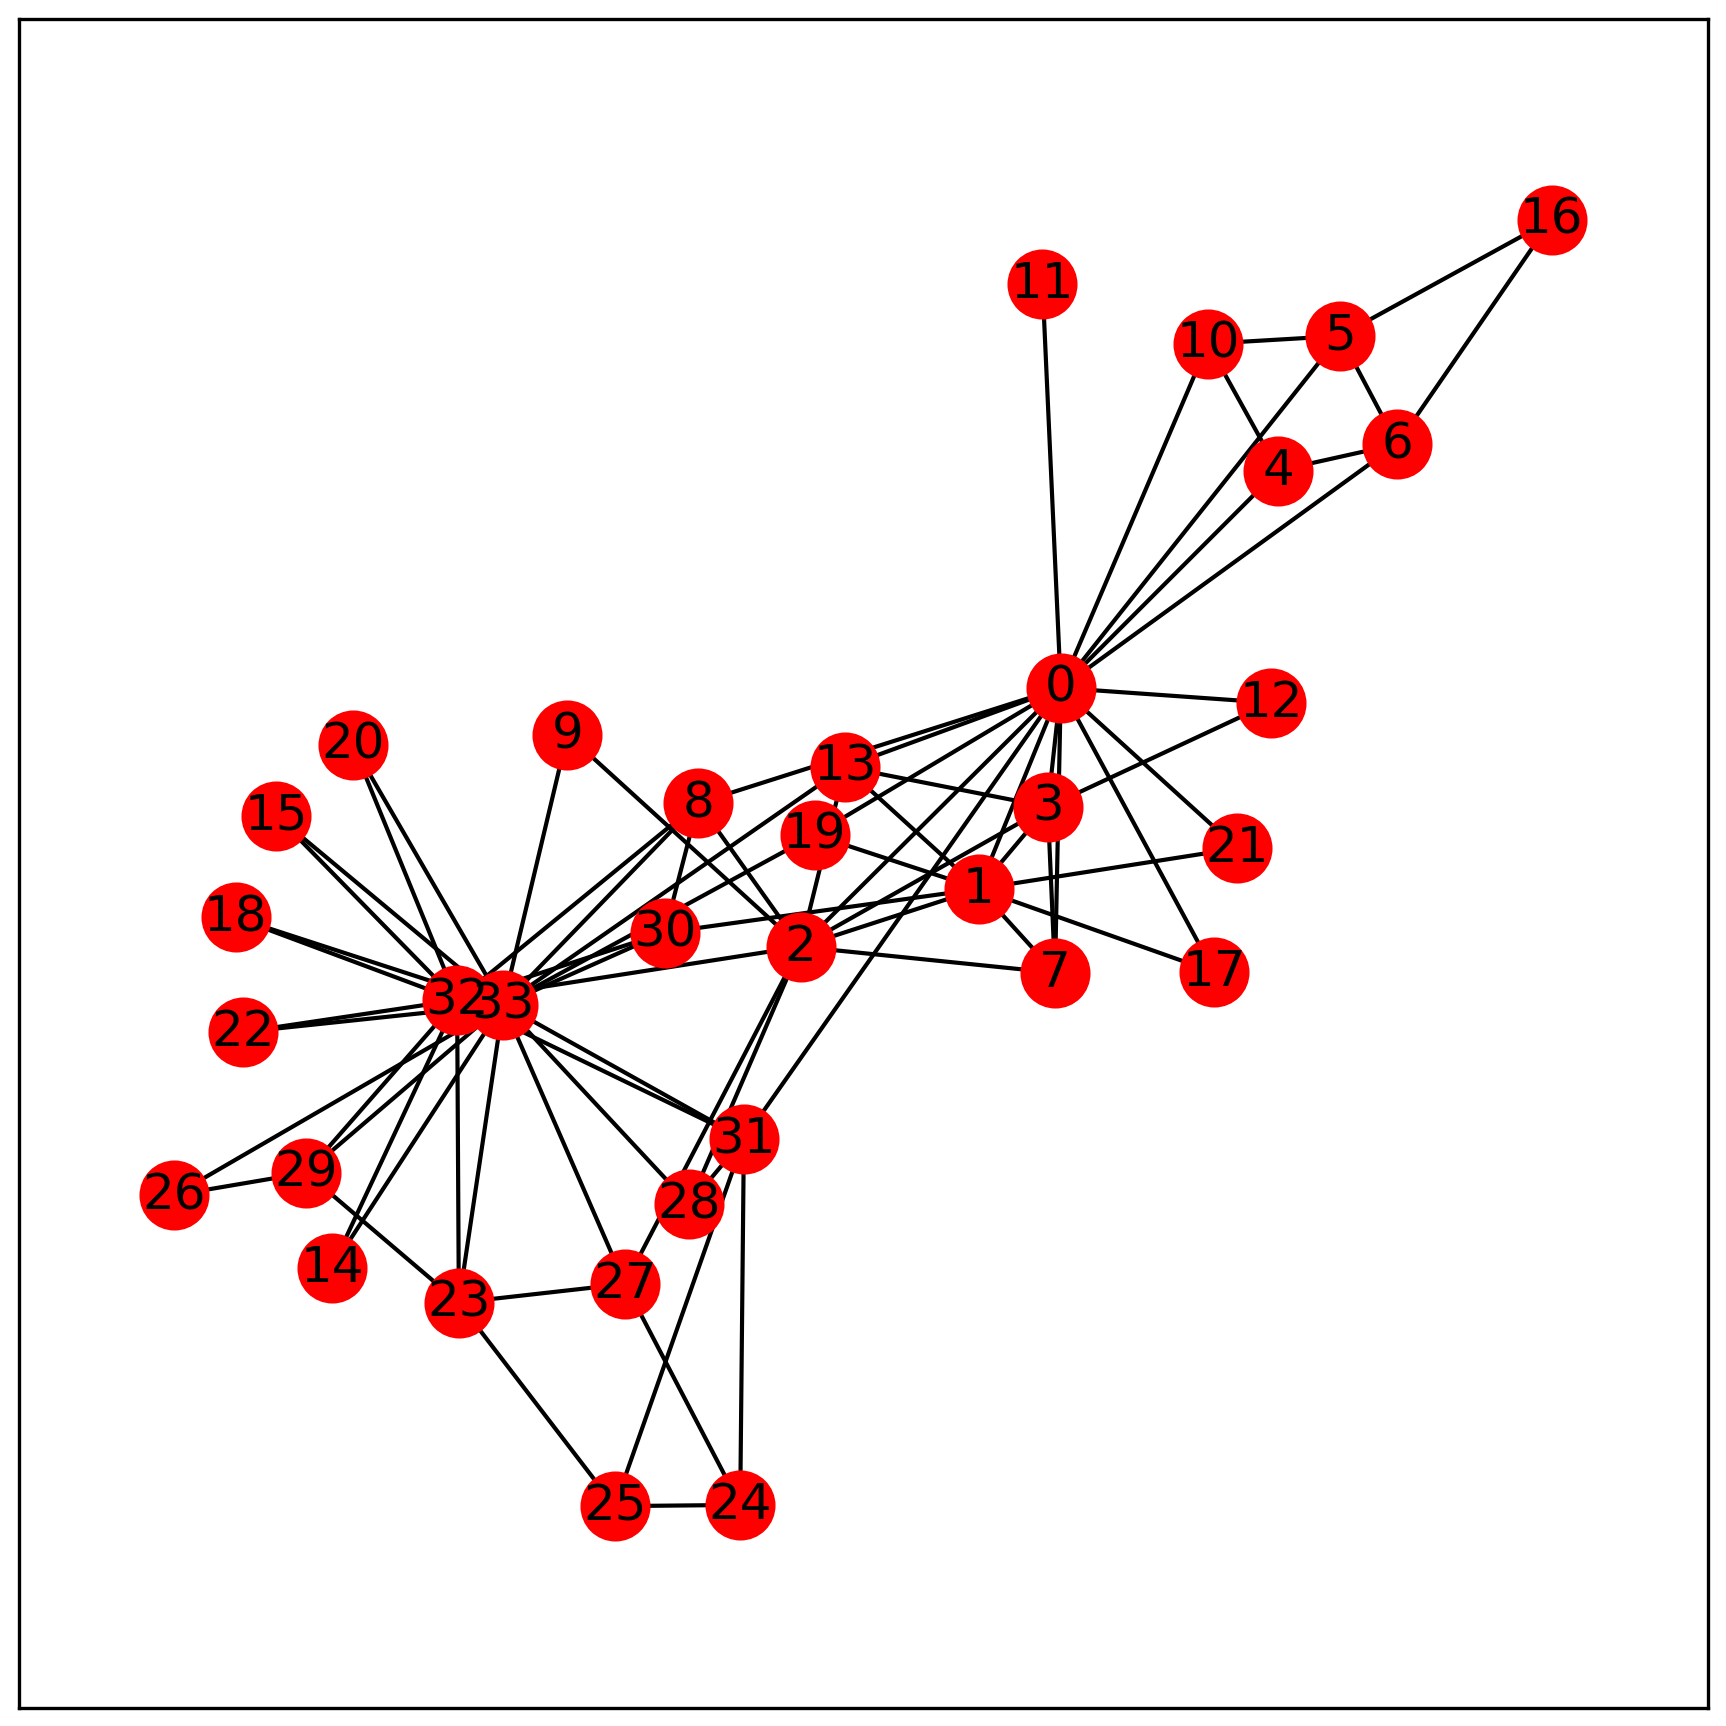
G = nx.karate_club_graph()
# Load ground-truth of Karate network
print("[Msg] Load grouhd-truth of Karate network.")
# ground_truth = [1, 1, 1, 1, 1, 1, 1, 1, 2, 2, 1, 1, 1, 1, 2, 2, 1, 1, 2, 1, 2, 1, 2, 2, 2, 2, 2, 2, 2, 2, 2, 2, 2, 2]
ground_truth = []
with open("karate-ground-truth.txt", "r") as f:
for s in f.readlines():
s = s.strip(" \t\r\n")
ground_truth.append(int(s.split()[1]))
# plot parameters
print("[Msg] Generate position of Force-Atlas2 layout for the network.")
plot_x_size = 6
plot_y_size = 6
plot_dpi = 300
# generate ForceAtlas2 layout position
pos = fa.forceatlas2_layout(G, iterations=200, linlog=False, nohubs=False)
x_max = -sys.maxsize
y_max = -sys.maxsize
x_min = sys.maxsize
y_min = sys.maxsize
for i in pos:
x, y = pos[i]
if x > x_max:
x_max = copy.copy(x)
if x < x_min:
x_min = copy.copy(x)
if y > y_max:
y_max = copy.copy(y)
if y < y_min:
y_min = copy.copy(y)
plot_axis_display_configuration = [x_min-0.2, x_max+0.2, y_min-0.2, y_max+0.2]
# create a figure
fig, axes = plt.subplots(figsize=(plot_x_size, plot_y_size), facecolor='w')
# draw network
nx.draw_networkx(G, pos=pos, node_size=250, with_labels=True)
# plot setting
axes.axis(plot_axis_display_configuration)
axes.xaxis.set_visible(False)
axes.yaxis.set_visible(False)
# save and show figure
plt.tight_layout()
plt.savefig("karate.png", dpi=plot_dpi, bbox_inches='tight', pad_inches=0.05)
plt.show()
plt.close(fig)
# save Karate network, ground-truth and pos to pickle file
print("[Msg] Save Karate network and its' ground-truth info. to pickle file.")
g_info = {}
g_info['graph'] = G
g_info['ground-truth'] = ground_truth
g_info['axis-display'] = plot_axis_display_configuration
g_info['axis-pos'] = pos
with open('karate.pickle', 'wb') as f:
pickle.dump(g_info, f)
print()
print(">>> STOP Karate graph generator")
- 參考檔案: karate_graph_generator.py
# coding=utf-8
# 匯入模組
import copy
import forceatlas as fa
import matplotlib.pyplot as plt
import networkx as nx
import random
import sys
import pickle


# 定義函數
def karate_graph_generator():
    print(">>> Karate graph generator")
    print()

    # create the Karate network
    print("[Msg] Create the Karate network.")
    G = nx.karate_club_graph()

    # Load ground-truth of Karate network
    print("[Msg] Load grouhd-truth of Karate network.")
    # ground_truth = [1, 1, 1, 1, 1, 1, 1, 1, 2, 2, 1, 1, 1, 1, 2, 2, 1, 1, 2, 1, 2, 1, 2, 2, 2, 2, 2, 2, 2, 2, 2, 2, 2, 2]
    ground_truth = []

    with open("karate-ground-truth.txt", "r") as f:
        for s in f.readlines():
            s = s.strip(" \t\r\n")
            ground_truth.append(int(s.split()[1]))

    # plot parameters
    print("[Msg] Generate position of Force-Atlas2 layout for the network.")
    plot_x_size = 6
    plot_y_size = 6
    plot_dpi = 300

    # generate ForceAtlas2 layout position
    pos = fa.forceatlas2_layout(G, iterations=200, linlog=False, nohubs=False)
    x_max = -sys.maxsize
    y_max = -sys.maxsize
    x_min = sys.maxsize
    y_min = sys.maxsize

    for i in pos:
        x, y = pos[i]

        if x > x_max:
            x_max = copy.copy(x)
        if x < x_min:
            x_min = copy.copy(x)
        if y > y_max:
            y_max = copy.copy(y)
        if y < y_min:
            y_min = copy.copy(y)

    plot_axis_display_configuration = [x_min-0.2, x_max+0.2, y_min-0.2, y_max+0.2]

    # create a figure
    fig, axes = plt.subplots(figsize=(plot_x_size, plot_y_size), facecolor='w')

    # draw network
    nx.draw_networkx(G, pos=pos, node_size=250, with_labels=True)

    # plot setting
    axes.axis(plot_axis_display_configuration)
    axes.xaxis.set_visible(False)
    axes.yaxis.set_visible(False)

    # save and show figure
    plt.tight_layout()
    plt.savefig("karate.png", dpi=plot_dpi, bbox_inches='tight', pad_inches=0.05)
    plt.show()
    plt.close(fig)

    # save Karate network, ground-truth and pos to pickle file
    print("[Msg] Save Karate network and its' ground-truth info. to pickle file.")
    g_info = {}
    g_info['graph'] = G
    g_info['ground-truth'] = ground_truth
    g_info['axis-display'] = plot_axis_display_configuration
    g_info['axis-pos'] = pos

    with open('karate.pickle', 'wb') as f:
        pickle.dump(g_info, f)

    print()
    print(">>> STOP Karate graph generator")


if __name__ == "__main__":
    karate_graph_generator()